
Building a Custom Low-Code NBA Dashboard in Retool
Andre Dubovskiy
In this tutorial I'll walk you through how I used our client Retool's low-code internal tools platform to build a dashboard to study the Dallas Mavericks' performance in the 2022 postseason.
I started by pulling data from ESPN into a Google spreadsheet with
=IMPORTHTML("https://www.espn.com/nba/team/roster/_/name/dal/dallas-mavericks","table",1)
This spreadsheet command goes to a given webpage and imports the first HTML table.
I ended up with the following stats:
Number, First, Last, POS, Age, HT, WT, College, Salary, Full, Pic, GP, GS, MIN, PTS, OR, DR, REB, AST, STL, BLK, TO, PF, AST/TO, PER.
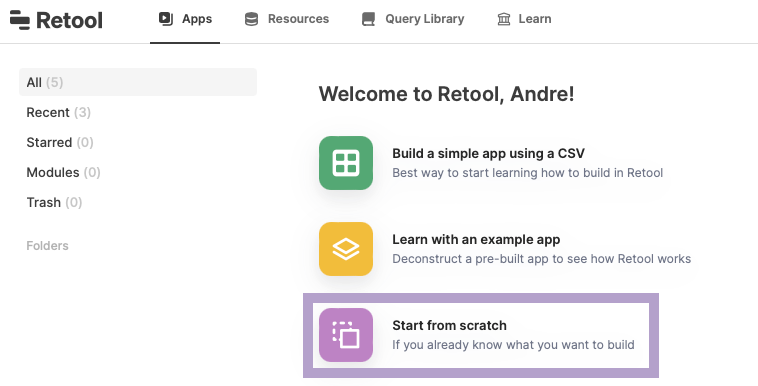
To get started with Retool, I made a trial account here and created an app from scratch.
Then I imported my table from Google Sheets by
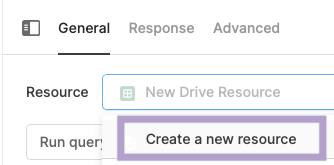
1. Creating a new Resource Query and adding my sheet
- You might have already connected Google Sheets when you created the app, but if not, add a resource from the bottom inspector.
2. Referencing the relevant cells with A1 notation in the query settings

3. Creating a Table widget by dragging it in from the Create tab on the right
- You might not have to do this given that Retool's "from scratch" template includes a table right off the bat
4. Setting the Data field of the table to {{query1.data}}, also on the right.
This tells Retool to pull the data from the query1 I created above.
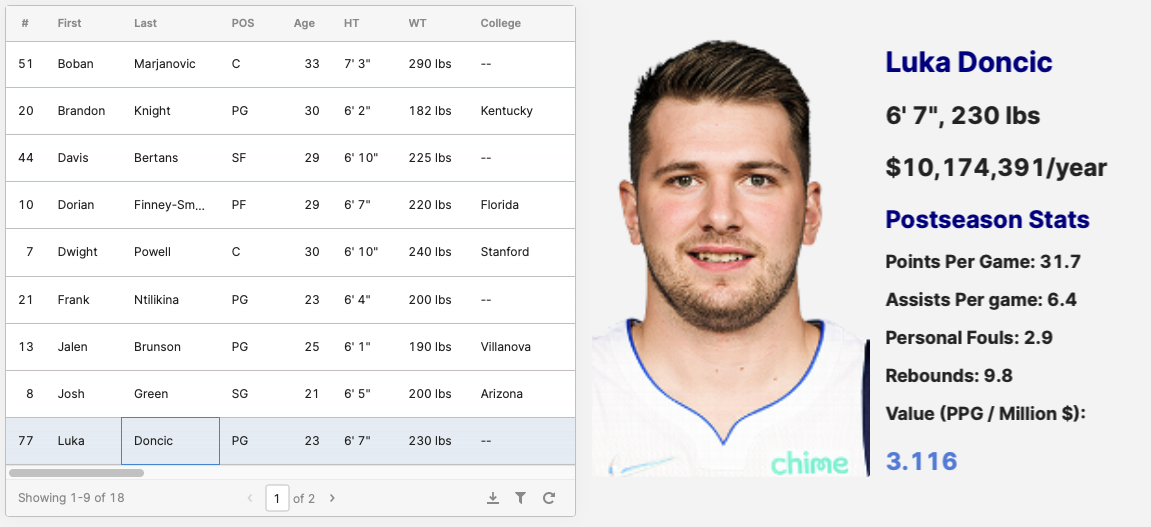
After that, I dragged in a new Image widget from the Create menu on the right. I wanted the picture to correspond to the selected player in the table (linked in the Pic column of each row). Rather than a static URL for the Image widget, one can use a variable like {{table1.selectedRow.data.Pic}}:
Retool lets you combine Markdown and variables to visualize the data in a dynamic fashion, and built-in variables like selectedRow make it really straightforward to create a reactive interface.
I added an individual stat viewer by mixing the following markdown cocktail.
## <span style="color:darkblue">{{ table1.selectedRow.data.Full }}</span>
### {{table1.selectedRow.data.HT}}, {{table1.selectedRow.data.WT}}
### ${{table1.selectedRow.data.Salary.toLocaleString("en-US")}}/year

### <span style="color:darkblue">Postseason Stats</span>
#### Points Per Game: {{table1.selectedRow.data.PTS}}
#### Assists Per game: {{table1.selectedRow.data.AST}}
#### Personal Fouls: {{table1.selectedRow.data.PF}}
#### Rebounds: {{table1.selectedRow.data.REB}}
#### Value (PPG / Million $):
### <span style="color:#5588DD">{{Math.round(table1.selectedRow.data.PTS/(table1.selectedRow.data.Salary/1000000)*1000)/1000}}
</span>
Beyond the statistics I found on ESPN, I included a custom "Value" index in the viewer. This tells you how many points a player scores per game for every $1M that they get paid. I'm not a sports analyst and don't know if this has been calculated before, or if it's useful, but at least I can brag to my friends that I invented my own basketball statistic :-)